Leading vs. Lagging Indicators

In this lesson, we’re going to streamline your use of these chart indicators.
We want you to fully understand the strengths and weaknesses of each tool, so you’ll be able to determine which ones work for you and which ones don’t.
Let’s discuss some concepts first. There are two types of indicators: leading and lagging.
A leading indicator gives a signal before the new trend or reversal occurs.
A lagging indicator gives a signal after the trend has started and basically informs you “Hey buddy, pay attention, the trend has started and you’re missing the boat.”
You’re probably thinking, “Ooooh, I’m going to get rich with leading indicators!” since you would be able to profit from a new trend right at the start.
You’re right.
You would “catch” the entire trend every single time, IF the leading indicator was correct every single time. But it won’t be.
When you use leading indicators, you will experience a lot of fakeouts. Leading indicators are notorious for giving bogus signals which could “mislead” you.
Get it? Leading indicators that “mislead” you?
Haha. Man we’re so funny we even crack ourselves up.
The other option is to use lagging indicators, which aren’t as prone to bogus signals.
Lagging indicators only give signals after the price change is clearly forming a trend. The downside is that you’d be a little late in entering a position.
Often the biggest gains of a trend occur in the first few bars, so by using a lagging indicator you could potentially miss out on much of the profit. And that sucks.
It’s kinda like wearing bell-bottoms in the 1980s and thinking you’re so cool and hip with fashion….
For the purpose of this lesson, let’s broadly categorize all of our technical indicators into one of two categories:
- Leading indicators or oscillators
- Lagging, trend-following, or momentum indicators
While the two can be supportive of each other, they’re more likely to conflict with each other. We’re not saying that one or the other should be used exclusively, but you must understand the potential pitfalls of each.
领先指标 VS 滞后指标

在这门课中,我们将教你如何简化的使用这些指标。
我们想让你充分的明白每个工具的优缺点,因此你才能够判断出,哪些工具可以和你联手,哪些工具不行。
接下来,先让我们讨论一些概念。指标分为两种类型:领先的 和 滞后的 。
领先的 指标给出信号时,都是在新的趋势 或 反转发生 之前 。
滞后的 指标给出信号时,往往是趋势已经完全形成 之后,然后才通知你“嘿,伙计,睡醒了没,这趟趋势早开始咯,你的宝船早就溜走了。”
你肯定这样想,“噢噢噢噢…,我只要使用领先指标,就可以快速致富了!”因为现在你能在新趋势开始时,就获得利润。
你这样想是没错的。
如果 领先指标每一次的信号是正确的话,你将“抓到”每一段完整的趋势。但这是不可能的事。
当你使用领先指标时,你将会习惯的接收到很多的假信号。领先指标可是以发出假信号,而臭名昭著的。它肯定会“误导”你的。
明白了吗?领先指标,会“哄骗”你的?
哈哈哈。。。朋友,我们已经笑得前仰后翻了。
另一种选择是使用滞后指标,它不会那么容易的给你假信号。
滞后指标只有在价格的波动,形成一种明显的趋势时,才会给出信号。它的坏处是:你的进场,将会稍微晚一点。
通常一个趋势最大的涨幅,就是在刚开始时的几根棒子发生的,所以使用一个滞后的指标时,你就肯定会错过大部分的利润。这真是烂透了。
这有点像在90年代穿着喇叭裤,你还认为自己是多么的有型,而且那么的时尚…….
在这节课里,我们把所有的技术指标,都分为两大类:
1. 领先指标 或 振荡器
2. 滞后指标 或 趋势跟踪指标
虽然这两种指标,同时可以彼此支援,但他们更容易相互抵触。我们不是说,只能单独的使用 其一个,但是你必须了解每一个指标的潜在缺点。
How to Use Oscillators to Warn You of the End of a Trend
An oscillator is any object or data that moves back and forth between two points.
In other words, it’s an item that is going to always fall somewhere between point A and point B. Think of when you hit the oscillating switch on your electric fan.
Think of our technical indicators as either being “on” or “off”. More specifically, an oscillator will usually signal “buy” or “sell”, with the only exception being instances when the oscillator is not clearly at either end of the buy/sell range.
Does this sound familiar? It should!
The Stochastic, Parabolic SAR, and Relative Strength Index (RSI) are all oscillators. Each of these indicators is designed to signal a possible reversal, where the previous trend has run its course and the price is ready to change direction.
Let’s take a look at a couple of examples.
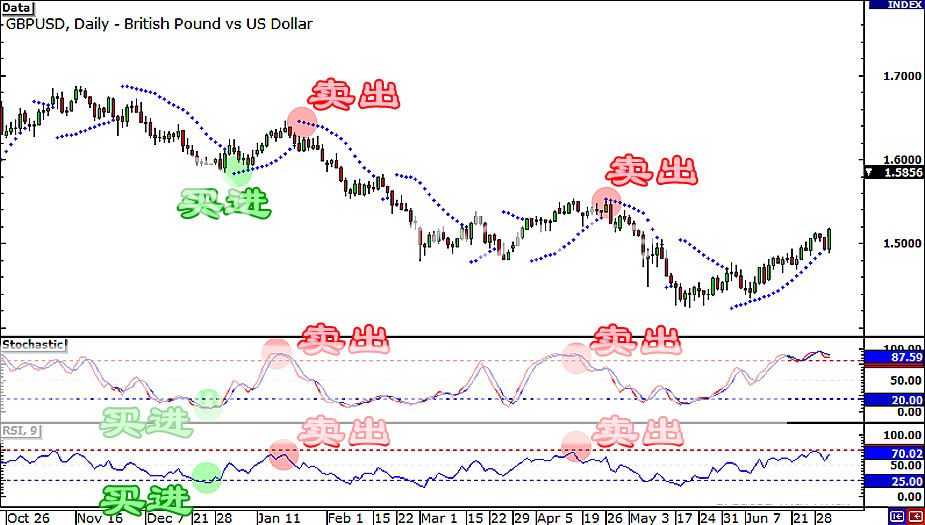
We’ve slapped on all three oscillators on GBP/USD’s daily chart shown below. Remember when we discussed how to work the Stochastic, Parabolic SAR, and RSI?
If you don’t, we’re sending you back to fifth grade!
Anyway, as you can see on the chart, all three indicators gave buy signals towards the end of December. Taking that trade would’ve yielded around 400 pips in gains. Ka-ching!
Then, during the third week of January, the Stochastic, Parabolic SAR, and RSI all gave sell signals. And, judging from that long 3-month drop afterwards, you would’ve made a whole lot of pips if you took that short trade.
Around mid-April, all three oscillators gave another sell signal, after which the price made another sharp dive.
Now let’s take a look at the same leading oscillators messing up, just so you know these signals aren’t perfect.
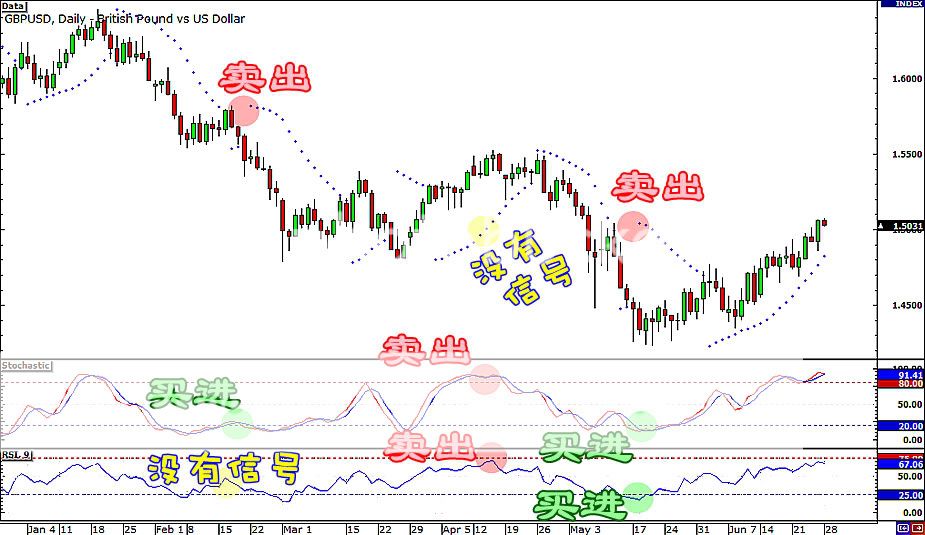
In the chart below, you can see that the indicators could give conflicting signals.
For instance, the Parabolic SAR gave a sell signal in mid-February while the Stochastic showed the exact opposite signal. Which one should you follow?
Well, the RSI seems to be just as undecided as you are since it didn’t give any buy or sell signals at that time.
Looking at the chart above, you can quickly see that there were a lot of false signals popping up.
During the second week of April, both the Stochastic and the RSI gave sell signals while the Parabolic SAR didn’t give one. The price kept climbing from there and you could’ve lost a bunch of pips if you entered a short trade right away.
You would’ve had another loss around the middle of May if you acted on those buy signals from the Stochastic and RSI and simply ignored the sell signal from the Parabolic SAR.
What happened to such a good set of indicators?
The answer lies in the method of calculation for each one.
Stochastic is based on the high-to-low range of the time period (in this case, it’s hourly), yet doesn’t account for changes from one hour to the next.
The Relative Strength Index (RSI) uses the change from one closing price to the next.
Parabolic SAR has its own unique calculations that can further cause conflict.
That’s the nature of oscillators. They assume that a particular price movement always results in the same reversal. Of course, that’s hogwash.
While being aware of why a leading indicator may be wrong, there’s no way to avoid them.
If you’re getting mixed signals, you’re better off doing nothing than taking a “best guess”. If a chart doesn’t meet all your criteria, don’t force the trade!
Move on to the next one that does meet your criteria.
领先指标(振荡器)
振荡器就是在两点之间来回移动的任何物件或数据。
另一个说法,它是一个总在 A点与B点 之间运动的东西。就像是,你 电风扇的 开/ 关 按钮。
我们的技术指标,就像你的按钮一样,不是“开”就是“关”。更确切的说,我们的振荡指标通常发出的不是“买进”就是“卖出”,但也有例外的情况,振荡指标有时会处在买和卖之间。
这听上去很熟悉吗?它确实如此!
随机振荡指标、抛物线以及相对强度指标(RSI) 都是振荡器。这些指标每一个,开始时都是被设计来,提示:可能会出现反,趋势已经走到头了和 价格已经准备随时会改变方向。
我们来看一些例子。
我们在 英镑/美元 的日图中,加入了三个振荡指标。还记得我们探讨过的随机振荡指标、SAR抛物线 以及 相对强度指标(RSI)是如何运作的吗?
如果你不记得,我们就会把你送回到 上一个的小学课程!
不管怎样,你可以看到图表上,这三个指标都在12月底给出做多的信号。下了买单的,已经赚得了接近400点的利润,听见入账的声音了吗Ka-ching!
之后,在一月的第三周,随机振荡指标、SAR抛物线指标 和 相对强度指标,都给出了做空的信号。然后,开始了长达 3个月的下跌,如果你早就下了卖单,你已经赚了一大堆的点数了。
大约在4月的中旬,这三个振荡指标又给出另一个做空的信号,之后价格再次大幅的下跌。
现在让我们来看看一些,振荡指标捣蛋的例子,这样你就知道这些信号并不是每次都完美。
在下面的图表中,你会发现有的指标给出了相互矛盾的信号。
举例,在2月中旬时,SAR抛物线给出了做空的信号,但随机振荡指标显示了正好相反的信号。你应该遵循哪一个?
然而,RSI指标这时候 似乎还在犹豫不决,它不懂究竟该给你做空 还是做多的信号。
从上面的图表,你可以很快的发现到,有很多的假信号出现。
在4月的第二个星期,随机振荡指标 和 RSI指标,两个都给出做空的信号,但这时SAR抛物线指标却没有给你发出信号。这段时间价格继续的攀升,如果你在那时段进场做了空单,你将会失去一些点数。
五月的中旬,你可能还会有一单亏损。如果你是因为随机振荡指标 和 RSI 指标,发出了做多的信号,就采取了行动,而无视 SAR抛物线 在嚷着做空的信号。
这套优良的指标组合,究竟出了什么问题?
这个问题的答案,就在它们每一种指标,各自的计算公式当中。
随机振荡指标,只是考虑某时间周期,价格的最高点 到 最低点之间的变化(在这个例子中,是指每小时)。但它是不考虑,从这个时间周期 到下一个时间周期 之间的价格改变。
而 相对强弱指标(RSI),是只注意这个收盘价 到 下一个收盘价 之间的变化。
最后的 SAR抛物线也拥有它独特的计算方法,这些就造成了它们信号的冲突。
这些就是振荡指标的特点。它们认为价格反转时,都会出现特定的价格波动。当然,这只是一派胡言。
虽然我们知道了领先指标为什么会发生错误,但却没有任何办法可以避免。
如果你得到了含混不清的信号,那最好是什么都不做,总比胡猜乱杠的强。如果一个图表不能满足你的交易准则,那就不要勉强交易!
往下一个图标去寻找,直到符合你的交易准则的才进行交易。
How to Use Momentum Indicators to Confirm a Trend
So how do we spot a trend?
The indicators that can do so have already been identified as MACD and moving averages.
These indicators will spot trends once they have been established, at the expense of delayed entry.
The bright side is that there’s less chance of being wrong.
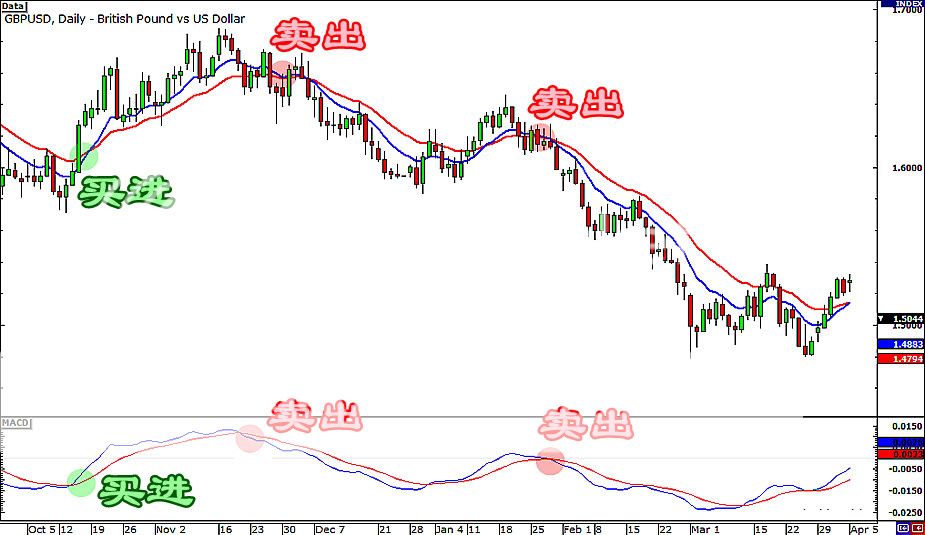
On GBP/USD’s daily chart above, we’ve put on the 10 EMA (blue), 20 EMA (red), and the MACD.
Around October 15, the 10 EMA crossed above the 20 EMA, which is a bullish crossover.
Similarly, the MACD made an upward crossover and gave a buy signal.
If you jumped in on a long trade back then, you would’ve enjoyed that nice uptrend that followed.
Later on, both the moving averages and MACD gave a couple of sell signals.
And judging from the strong downtrends that occurred, taking those short trades would’ve given huge profits.
We can see those dollar signs flashing in your eyes!
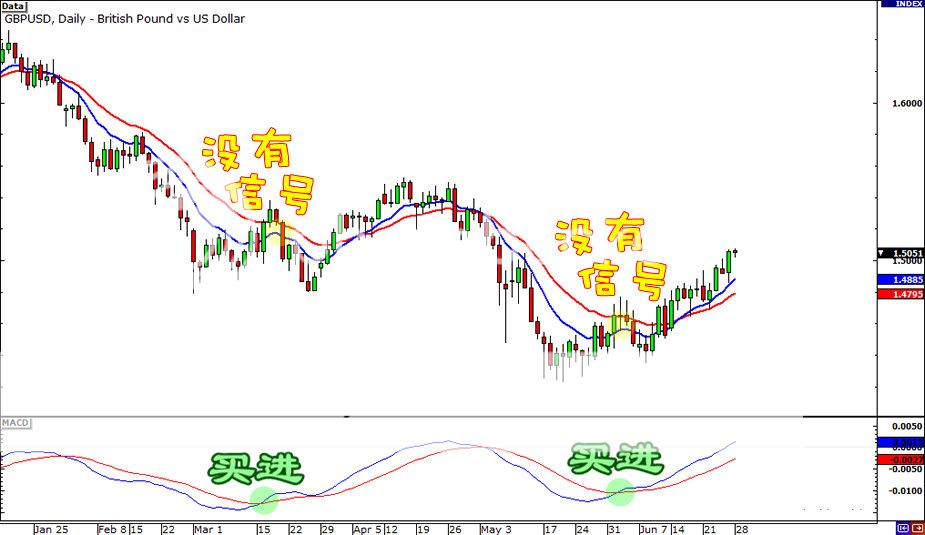
Now let’s look at another chart so you can see how these crossover signals can sometimes give false signals. We like to call them “fakeouts.”
On March 15, the MACD made a bullish crossover while the moving averages gave no signal whatsoever.
If you acted on that buy signal from the MACD, you just suffered a fake out, buddy.
Similarly, the MACD’s buy signal by the end of May wasn’t accompanied by any moving average crossover. If you entered a long trade right then and there, you might’ve set yourself up for a loss since the price dipped a bit after that.
Bummer!
滞后的指标(趋势指标)
那么我们如何发现一个趋势呢?
可以用来发现趋势的指标,已经确定了有: MACD 和 移动平均线。
这些指标能够在趋势成立时,发现它们,但代价是错过进场的最好时机。
它们的优点是:犯错的机会很少。
以上是 英镑/美元的日图,我们加上 10 EMA(蓝色)、20 EMA(红色) 和MACD。
在10月15日,10EMA 向上穿过 20EMA,这是一个牛市的交叉信号。
同样的,MACD 做出了一个向上的交叉 和 买进的信号。
如果当时你马上跳入多头的行列,你将会享受到这接下来的上升趋势。
接下来,移动平均线 和 MACD 都给出了做空的信号。
从接下来的强烈的下跌趋势来看,那些做了空单的将会获得巨大的利润。
我们可以在你的眼睛里,看到闪烁的 $$$ 符号。
现在让我们来看另一个图表,这样你就可以看到,交叉信号有时也会有愚弄你的情况。我们习惯称它们为“假信号”
在 3月15日,MACD 做出了一个牛市的交叉,而移动平均线却没有发出任何的信号。
朋友,如果你按照 MACD 的信号下了单,你就踩到了一个假信号。
同样的在5月底 时,只有 MACD 发出了买进的信号。如果那时你立刻下了多单的话,之后价格的稍微下跌,可能已经导致你亏损了。
这真是让人扫兴!
Summary: Leading and Lagging Indicators
Here’s a quick recap of what we discussed in this lesson:
There are two types of indicators: leading and lagging.
- A leading indicator or an oscillator gives a signal before the new trend or reversal occurs.
- A lagging indicator or a momentum indicator gives a signal after the trend has started.
If you’re able to identify the type of market you are trading in, you can pinpoint which indicators could give accurate signals and which ones are worthless at that time.
So, how do you figure out when to use oscillators or momentum indicators, or both?
That’s another million dollar question! After all, we know they don’t always work in tandem.
We’ll give you a million dollars really soon…
Oh wait! We meant the million dollar answer!
For now, just know that once you’re able to identify the type of market you are trading in, you will then know which indicators will give accurate signals, and which ones are worthless at that time.
This is no piece of cake. But it’s a skill you will slowly improve upon as your experience grows.
Besides…
You’re not at it alone!
In the future sections, we’re going to teach you how to correctly identify the forex market environment you are trading in to better use these indicators!
总结:领先指标 和 滞后的指标
这是一个简便的复习,关于我们课程中所谈论的内容:
所有指标分成两种:领先的和滞后的。
1. 领先指标或震荡指标,在新趋势的开始或者逆转发生之前,就发出了信号。
2. 滞后指标或动量指标,在新趋势的开始或者逆转发生之后,才会发出信号。
如果你能够先识别出,正在进行交易的市场是什么类型,你就能选出哪种指标,可以给出准确的信号,或是哪些指标在那时段没有价值。
因此,你该如何判断出,何时使用震荡指标或趋势指标,还是两者皆可呢?
这又是另一个价值百万的问题!但在这堂课之后,我们已经知道它们是不会并肩一起解决问题的。
很快的,我们会给你一个百万美金。。。
哦,等等!我们的意思是,一个价值百万美金的答案!
到现在为止,你只知道一旦能够识别,你正在交易的市场是属于什么类型。你就会知道哪个指标可以给您提供精确的信号,而哪些指标在这时候是一文不值的。
这并不是小菜一碟。但这是一种技术,一种随着你的经验增长,而慢慢提升的技术。
此外…
你并不是孤独一人的,学习这些技数。
在接下来的课程中,我们将会教你将如何正确的,分辨出你所交易的市场环境,以及更好的使用这些指标。


